The assignment this week involved examining a data set of pre-boarding screener turnover and security violations detected at US airports between 1988 and 1999. The instructor selection 20 data points at random and asked us to check for correlations.
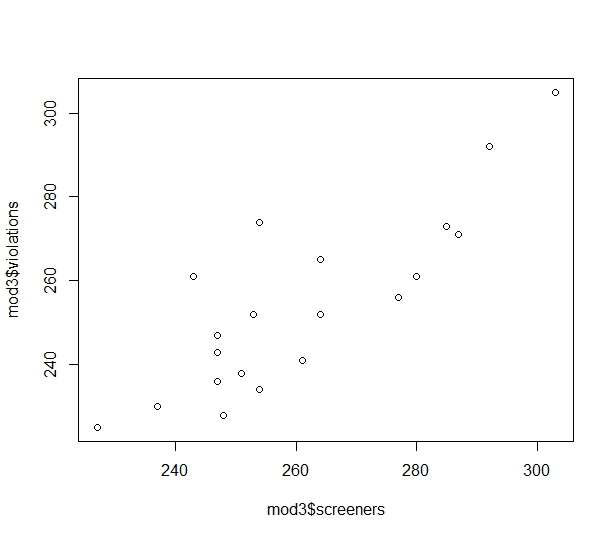
The first task was to describe the association between the screener data and violations data. Based on the number crunching in the questions that followed, it appears that there was a fairly strong positive correlation between screener turnover and the number of security violations detected.
The next tasks involved calculating the Pearson’s sample correlation coefficient and the Spearman’s rank coefficient, then to create a scatterplot of the data. The code for those tasks follows (after importing the data from the assignment page into my RStudio workspace):
cor.test(mod3$screeners, mod3$violations)
cor.test(mod3$screeners, mod3$violations, method="spearman")
plot(mod3$screeners, mod3$violations)
Pearson’s coefficient: 0.8375321
Spearman’s coefficient (rho): 0.7575423
Scatterplot: